Reading the Market's Pulse: How Microstructure Data Sharpens Entry and Exit Decisions on Exchange777
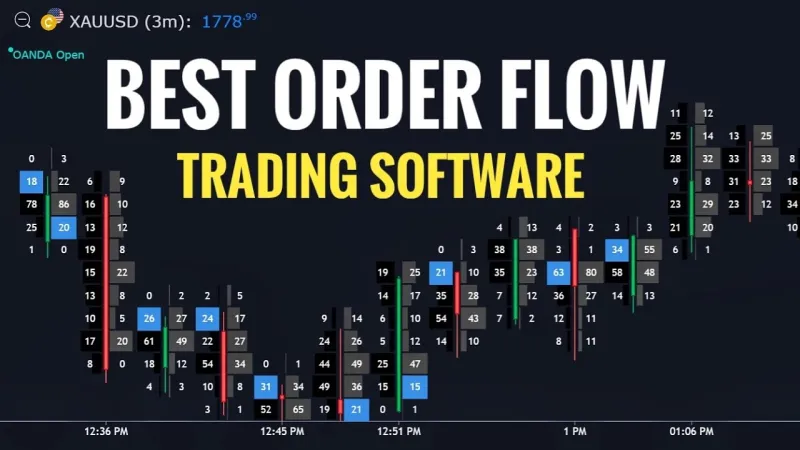
Photo: cryptocurrency trading order flow data analysis professional trader screens, via i.ytimg.com
Most retail traders in the United States are taught to read markets through a relatively narrow lens: candlestick charts, volume bars, and a handful of lagging indicators like RSI or MACD. These tools are not without merit, but they represent only the surface of what an exchange actually reveals about price behavior. Beneath every completed candle lies a continuous stream of transactional data—order flow, bid-ask dynamics, executed trade sizes, and liquidity shifts—that sophisticated participants analyze in real time to gain a decisive timing advantage.
This is the domain of market microstructure analysis, and it is increasingly accessible to retail traders who know where to look and what to measure.
What Market Microstructure Actually Measures
Market microstructure is the study of how trades are executed, how prices are formed at the order level, and how liquidity providers and takers interact within an exchange environment. Unlike traditional technical analysis, which interprets historical price patterns, microstructure analysis focuses on the mechanics of price discovery as it unfolds in real time.
For cryptocurrency traders, this means examining data points that most charting platforms do not display by default: the ratio of aggressive buy orders to aggressive sell orders, the rate at which the bid-ask spread narrows or widens, the clustering of large limit orders at specific price levels, and the speed at which executed trades arrive. Each of these signals carries information about the intentions of market participants—including institutional actors whose order strategies often leave detectable footprints before a major price move materializes.
Delta Volume: The Hidden Imbalance Inside Every Candle
One of the most practical microstructure metrics available to active traders is delta volume, sometimes referred to as order flow delta. Delta measures the difference between the volume of buy-initiated trades (market orders hitting the ask) and sell-initiated trades (market orders hitting the bid) over a given period.
A candle that closes modestly higher may appear unremarkable on a standard chart. But if the underlying delta for that candle shows that buyers overwhelmed sellers by a ratio of three to one, the signal carries substantially more weight. Conversely, a price level that holds steady despite a strongly negative delta—meaning sellers are pressing aggressively but price refuses to decline—often indicates that a large buyer is absorbing supply, a classic accumulation signature.
Delta volume divergence is particularly valuable at support and resistance zones. When price revisits a prior level and the delta pattern differs significantly from the first visit, the probability of a breakout or breakdown shifts measurably. Traders using Exchange777 can cross-reference these patterns with the platform's real-time data feeds to assess whether a level is likely to hold or fail before committing capital.
TWAP Anomalies and What Institutional Execution Looks Like
Time-Weighted Average Price, or TWAP, is a widely used execution benchmark among institutional traders. Large funds seeking to accumulate or distribute positions without causing excessive market impact will often break their orders into smaller tranches executed steadily over time—a strategy explicitly designed to blend into normal market activity.
However, this strategy leaves statistical fingerprints. When the executed price for a given asset tracks unusually close to TWAP over an extended window—particularly during periods of low volatility—it frequently indicates algorithmic accumulation or distribution in progress. Retail traders who monitor TWAP adherence alongside volume patterns can sometimes identify these windows before the underlying position is fully established, positioning themselves ahead of the resulting directional move.
This is not a guaranteed signal, and no microstructure indicator should be treated as infallible. But TWAP anomalies, when combined with other confluence factors, add a meaningful layer of context that standard chart analysis simply cannot provide.
Spread Compression as a Pre-Move Signal
The bid-ask spread—the difference between the highest price a buyer will pay and the lowest price a seller will accept—is one of the most dynamic and informative data points on any exchange. In liquid markets, spreads are typically tight. During periods of uncertainty or low participation, they widen. But there is a third condition that many traders overlook: spread compression before a significant price move.
In certain market conditions, particularly when a large directional participant is preparing to execute, the spread will tighten sharply even as volume remains subdued. This compression reflects an unusual alignment of buyer and seller intentions at a specific price level—a temporary equilibrium that often precedes a sudden expansion in either direction. Monitoring spread behavior on Exchange777 in the minutes surrounding key technical levels or scheduled macroeconomic events can provide an early warning that volatility is about to increase.
For US traders accustomed to equity market dynamics, this concept has a rough parallel in options implied volatility behavior ahead of earnings releases—the calm before the storm is itself informative.
Interpreting Order Book Depth Without Being Misled
The visible order book offers a snapshot of resting limit orders at various price levels, but experienced traders know that raw depth can be deceptive. Large limit orders may be spoofed—placed with the intent to cancel before execution—while genuine institutional interest is often disguised through iceberg orders that display only a fraction of their true size.
The more reliable signal comes not from the static appearance of the book but from its rate of change. How quickly do large orders refresh after being partially filled? Are bid-side orders being added as price declines, suggesting genuine support, or are they withdrawing as price approaches, suggesting a defensive posture? Tracking these dynamics in real time, rather than relying on a single snapshot, provides a materially more accurate picture of where genuine liquidity resides.
Exchange777's data infrastructure is designed to support this kind of dynamic order book analysis, giving traders the granularity needed to distinguish between structural support and illusory depth.
Building a Microstructure-Informed Trading Routine
Integrating microstructure analysis into a practical trading workflow does not require a proprietary data terminal or a quantitative finance background. It does, however, require a shift in focus—from asking "what has price done" to asking "how is price being made right now."
A disciplined approach might include the following steps before entering any significant position:
Assess the delta trend. Over the past fifteen to thirty minutes of trading, has aggressive buying or selling dominated? Does the current delta reading confirm or contradict the price trend?
Check for TWAP adherence. Is price tracking unusually close to its time-weighted average without the normal fluctuations? This may indicate algorithmic activity.
Observe spread behavior. Is the spread compressing near a key level? Unusual tightening without a corresponding volume spike deserves attention.
Evaluate order book dynamics. Are large resting orders holding firm as price approaches, or are they being pulled? The behavior of resting liquidity often reveals more than its presence.
Combining these observations with traditional technical context—trend direction, key support and resistance levels, broader market sentiment—creates a more complete picture of the risk-reward environment before any trade is placed.
The Competitive Advantage of Seeing What Others Miss
Cryptocurrency markets in 2025 are increasingly efficient at the surface level. Price patterns that once generated reliable returns have been arbitraged away by algorithmic participants operating at speeds no human trader can match on a candlestick-by-candlestick basis. The edge for informed retail traders lies increasingly in the layers beneath price—in the mechanics of how orders interact, how liquidity shifts, and how institutional participants reveal their intentions through execution behavior.
Market microstructure analysis does not eliminate uncertainty. No analytical framework does. But it equips traders with a more complete vocabulary for reading what an exchange is actually communicating, rather than simply what its charts display. For US traders committed to approaching digital asset markets with the same rigor applied to any serious investment discipline, this layer of analysis represents one of the most underutilized advantages available today.